Color Uniformity of Electrophotographic Presses
Dr. Anthony Stanton *, Dr. Mark Bohan **, and Lindsay Ferrari **
* Carnegie Mellon University ** Printing Industries of America
Published 2014
DownloadAbstract
This study extends the color uniformity study published by Stanton, Bohan, and Ferrari in the 2013 TAGA Proceedings. (Stanton, et al, 2013)
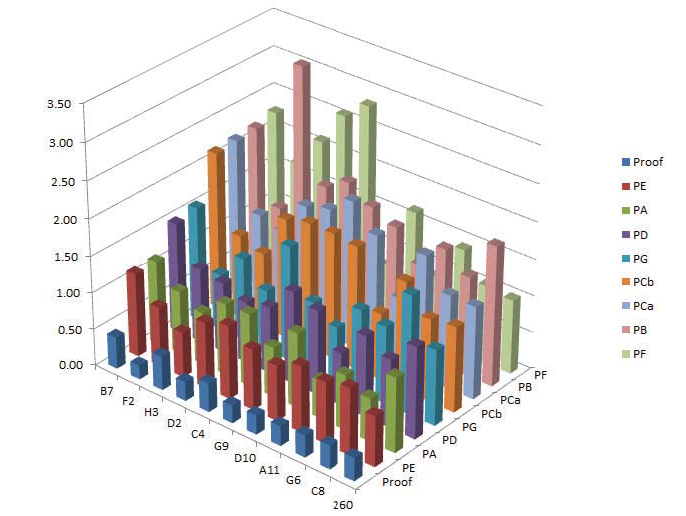
The 2014 study examined the color uniformity of seven electrophotographic press systems compared to the color uniformity of an Epson inkjet proofing device. The electrophotographic presses were coded for this study as PA through PG. One of the electrophotographic presses, PC, was tested under two different conditions: before and after cleaning and maintenance. These two conditions are coded as PCb and PCa, respectively.
Eleven test pages were measured for each press. Each of the 11x17-in. pages was filled with a solid color. The colors were chosen based on their performance in the 2013 study of color uniformity. Large solid-color areas allowed for comprehensive measurements of color uniformity, and mimicked a common requirement in advertising printing for large areas of solid color.
Although subjective evaluations were not used in this study, the large solid prints contained streaks and other defects that were not apparent in the 2013 study, where small color spots repeated across the page were used for calculation of color uniformity. The authors feel that objectively characterizing these defects is a good topic for further study.
The color uniformity index used for this study was based on ∆E2000 color difference values calculated from all of the paired comparisons from 96 uniformly spaced CIELAB measurements that were made from each sheet, or 4,560 comparison pairs per sheet. The ∆E2000 values represent calculated differences between two color samples on a scale correlated to human perception. The relationship is designed such that one ∆E2000 unit equates to a just noticeable difference for a standard human observer under a defined light source.
The mean of the 4,560 ∆E2000 values for a given sheet yielded the color uniformity score. Lower mean values indicate more uniformity of color. For each press in the study, the color uniformity scores for the 11 colors included in the study were averaged to determine that press’s overall color uniformity score. The uniformity scores for each of the presses were based on 50,160 calculated ∆E2000 values. The large sample sizes resulted in tight confidence intervals around the estimation of mean color uniformity scores.
The hypothesis of the study was that the color uniformity scores for all of the electrophotographic presses would be equal and that the uniformity of the individual colors would also be equal. Based on the 2013 study, it was assumed that the inkjet proofing device would have better color uniformity than the electrophotographic presses.
ANOVA testing revealed that the color uniformities of the seven electrophotographic presses were significantly different from one another with the exception of presses PA and PE, which were found to be equal. These two presses also had the best color uniformity of the electrophotographic presses. The range of mean ∆E2000 values for the electrophotographic presses was 0.96. Thus, the average color difference for the least uniform of the presses was about one just noticeable difference higher than the average color difference for the most uniform press. None of the electrophotographic presses exhibited extremely poor color uniformity compared to the group. Interestingly, the press that was tested before and after cleaning and maintenance (PC) had better color uniformity before cleaning than after.
As expected, the inkjet proofing device had significantly better color uniformity than any of the electrophotographic presses. The uniformities for individual colors across all electrophotographic presses were also found to be different from each other, with the exception of two colors: G6 and G9, the two colors in the study from the red domain. The ranking of the colors in order from greatest to least color uniformity is shown in Table 5. Overall, the pastel colors had the best color uniformity, and darker, near-neutral colors were among the worst.
When the influences of individual colors were tested for individual presses, the results were complex. There were different equal and unequal colors for each press and different ranking orders for the individual colors. These results are summarized in Table 7. A composite ranking for each of the colors was calculated and is shown in Table 8.
The researchers observed that there were distinct differences in color uniformity between several of the printed samples, but no systematic attempt was made to calibrate the subjective impression of uniformity with the measured differences.