Evaluation of Light Measurement Instruments
Bruce Leigh Myers, Ph.D.
Rochester Institute of Technology
Published 2019
DownloadAbstract
The International Standards Organization (ISO) defines standards to ensure that viewing conditions are consistent when evaluating printed samples through ISO 3665 (2009), Graphic technology and photography – viewing conditions. The need for this standard stems from the necessity for human visual assessment as the key arbiter of the quality of complex images, and the tendency for various lighting conditions to shift the appearance of a color, specifically in relation to other adjacent colors.
Among the conditions specified by ISO 3665 (2009) are Correlated Color Temperature (CCT) and Color Rendering Index (CRI). Berns (2000) describes CCT as “Temperature, usually expressed in kelvins, of a blackbody radiator that most closely resembles the color of a stimulus of equal brightness” (p. 4). Color rendering is described by Field (2004) at “…the degree to which a test illuminant (e.g., fluorescent light) renders colors similar in appearance to their appearance under a reference daylight illuminant of the same color temperature” (p. 4). A method for determining CRI is defined by the Commission Internationale de l’Éclairage (CIE) for a given light source. Field (2004) states: “The optimal CRI (that for daylight, or for such continuous sources as tungsten lamps) is given as 100” (p. 4). CRI is expressed as CRI Ra, with Ra representing the international standard for CRI as defined by CIE 13.3-1995.
Both CCT and CRI Ra are quantifiable by a range of instruments, including traceable Spectroradiometers specifically designed for the purpose, general-use Spectrophotometers that can read CCT and CRI Ra, and handheld instruments designed for photographic applications that measure CCT.
The present study seeks to compare readings from a traceable Spectroradiometer with those from various other meters across a range of seven viewing booths, some of which are known to be out of specification. The goal is to ascertain how much variance can be expected when using these varied meters when compared to a traceable benchmark instrument. For the purposes of this study, the benchmark instrument is referred to as the reference instrument, and the other measurement devices are the test instruments.
To determine the variability of the seven viewing booths used, at least 10 readings were taken with the SpectriLight ILT 950 in each booth, as illustrated in Table 2. As ISO 3665 (2009) mandates a CRI Ra value over 90, it is noted that booths 1 and 2 are in compliance, booths 3,4, and 5 are nearly out of specification for that metric, and booths 6 and 7 are well out of compliance. This level of variance represents a range of variability that provides a means to compare the instruments tested across dissimilar viewing conditions.
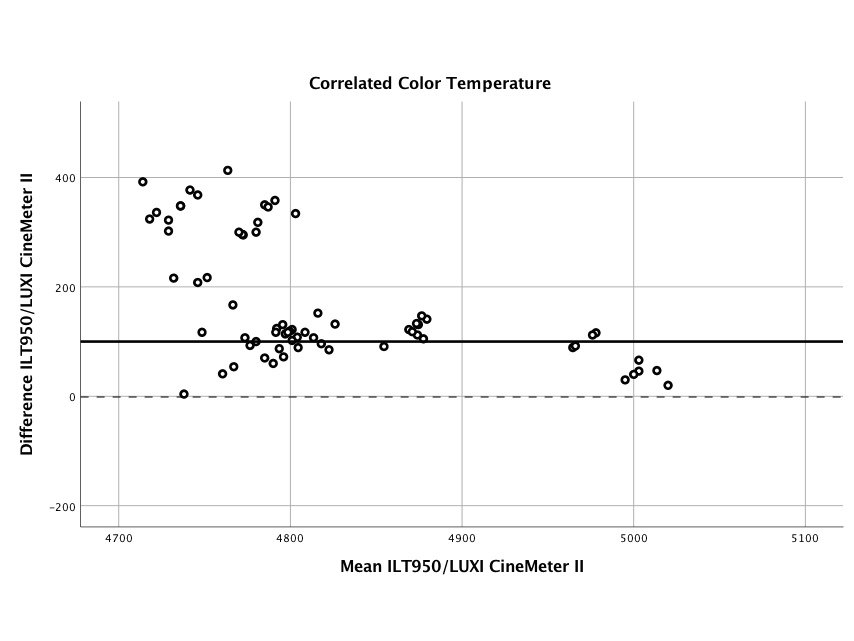
For a test instrument, measurement technique cannot be considered accurate unless measurements of a particular variable by the test instrument agrees closely with a reference instrument across all applied instances. A graphical approach to analyzing the comparison of a test and reference method that addresses these concerns as advanced by Bland and Altman (1986) and is referred to as the Bland-Altman (B-A) plot, and alternatively known as the Tukey Mean-Difference plot. Bland and Altman are credited with popularizing the use of this technique, and in the words of Earthman (2015): “They did not invent the method, but they advocated its application to the comparison of medical devices, laboratory tests, and other clinical techniques to ascertain bias in one method compared with another” (p. 794).
A B-A plot illustrates the mean difference between the two methods on the x-axis, and difference between paired readings of the two methods on the y-axis includes calculations of limits of agreement (LOA) when applicable (typically described as mean difference +/- 1.96 standard deviation to represent 95% confidence).
The procedure for comparison is to first calculate the difference between the two methods as a new variable, and then to conduct a one sample t-test on this result to examine a potential systematic bias. When examining CRI Ra, 95% LOAs are calculated to visually analyze how far apart measurements are likely for most applications; these LOAs are determined by multiplying the standard deviation of mean difference by 1.96, and then adding/subtracting the resulting value from the mean difference.