Optimal Test Charts
Thorsten Braun 1 and Jodi Alejandro 2
1 ColorLogic GmbH; 2 CrossXColor, Inc.
Published 2019
DownloadAbstract
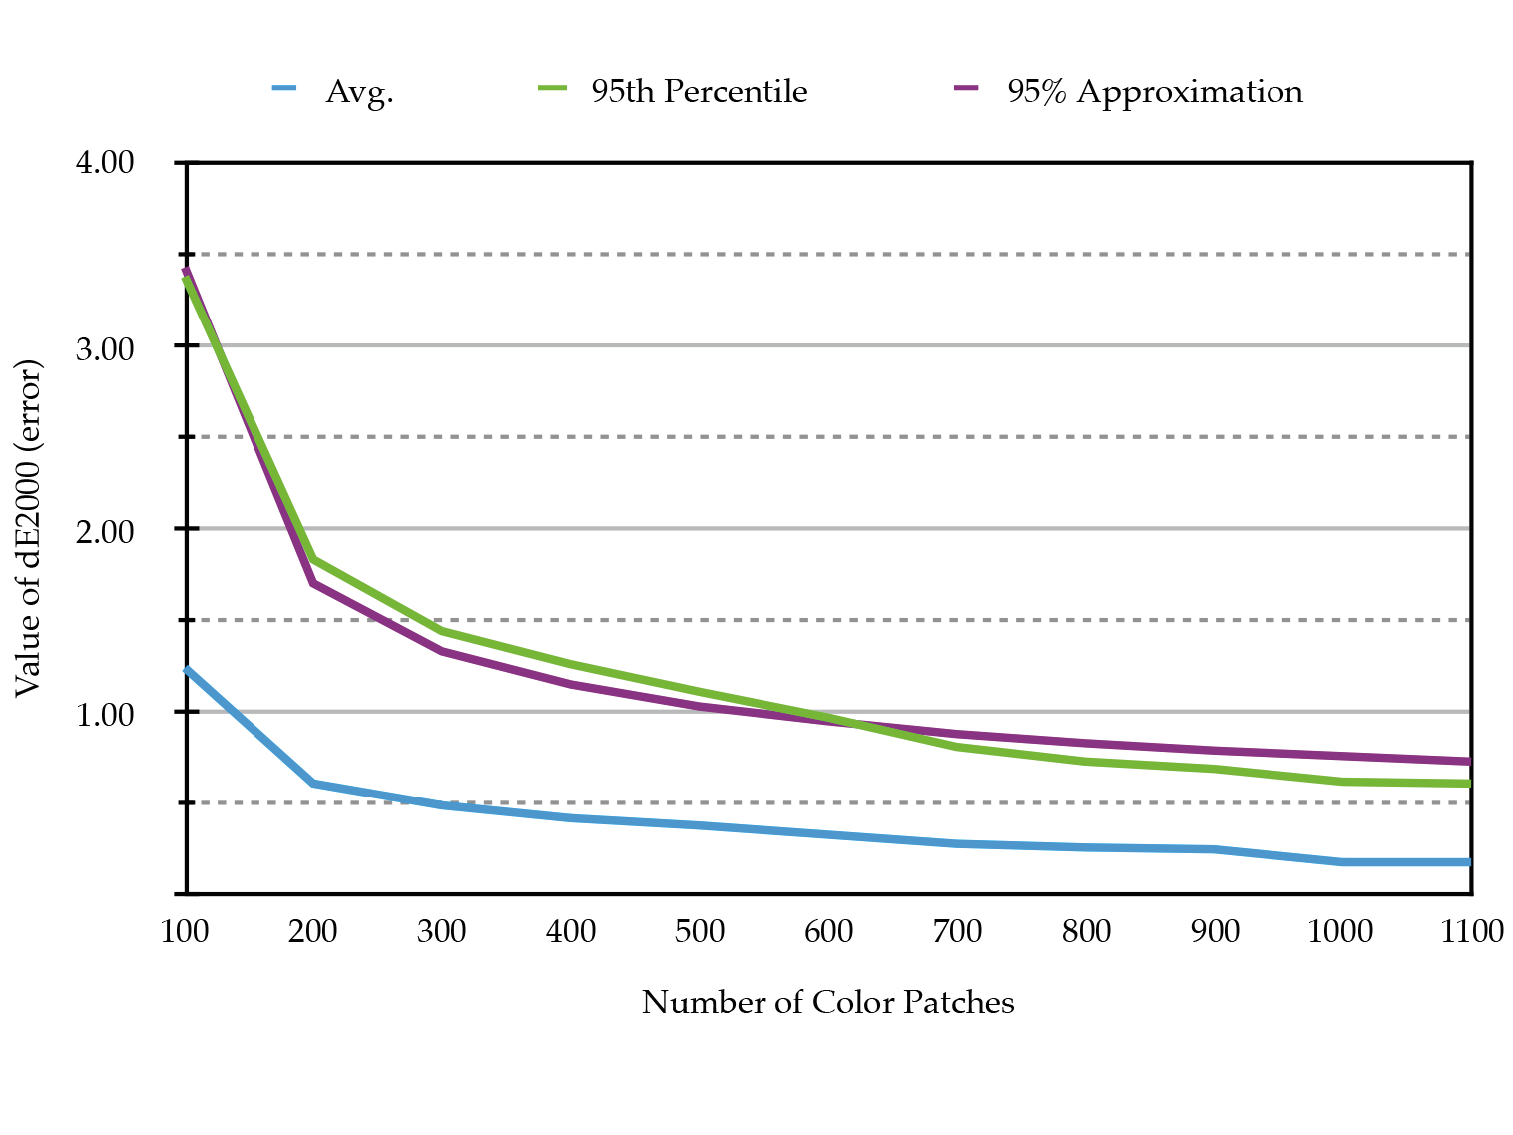
This paper will discuss the analysis of determining the ideal number of color patches to produce ‘optimal test charts’. A test chart consisting of 8,000 patches does not necessarily mean that the fingerprint or characteristic of an output system is more accurate than using a test chart with less patches such as 500. How much quality is really gained by increasing the number of patches?
We will introduce a simple formula predicting the expected quality when varying the test chart size and discuss the results.